

Table of Contents
What is Grafana?
Grafana is a free and open source (FOSS/OSS) visualization tool that can be used on top of a variety of different data stores but is most commonly used together with Graphite, InfluxDB, Prometheus, and Elasticsearch.
Grafana Alerting
Grafana Alerting typically allows you to learn or understand the problems in your system, just a few moments after they occur. Enabling you to create, manage, and take action on your alerts in a single, consolidated view, and overall improve your team’s ability to identify and resolve issues as fast as possible. It is available for Grafana OSS, Grafana Enterprise, or Grafana Cloud.
How do Grafana Alerts work?
The below diagram will give you an overview of how Grafana Alerting functions, while introducing you to some of the key concepts that work together in Grafana.

Overview: Grafana Alerting
How to create and configure Alert Rules
If you want to receive notifications about alerts, you should set up one notification channel. Many notification channels are available as add-ons on MetricFire such as Slack and PagerDuty. How to use Slack as the notification channel for MetricFire’s product, Hosted Graphite. However, using notification channels is not a requirement for alerting.
You can create alert rules independently for each dashboard panel. For example we have the dashboard that monitors three fields (parameter_1, parameter_2, parameter_3) from our Elasticsearch index:

Edit the panel:

Then click on the Alert button (the bell icon):

And finally, click on the Create Alert button:

Now we need to configure the alert:

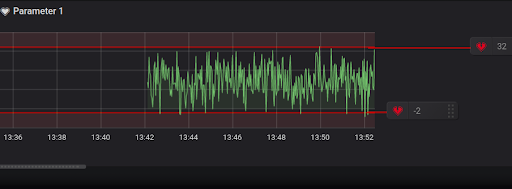
As you can see, we give it a name, set the frequency for the evaluation, and set the specific conditions of the Alert. For this particular alert, we want to be notified when the average value of the parameter_1 is out of range [-2 : 32]. As the Python script is producing values between -5 and 34, the value will sometimes be outside the range [-2 : 32].
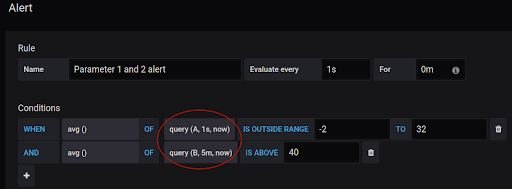
When looking at the conditions section, you can see the query (A, 1s, now) part. Let’s explain what these parameters mean. “A” is the query used to visualize the metric. You could see the place where this query was defined in one of the previous images (before clicking on the button with the bell). In our case, it is an average for the parameter_1 over the last 1 second. The parameters “1s” and “now” set the time range and represent: “1 second ago to now”. Below the Conditions section, you can also configure the behavior of the alert when missing data or errors occur. This is very significant, as missing data can be frequent.
On the graph below, you will see the convenient visualization of the alert’s conditions:
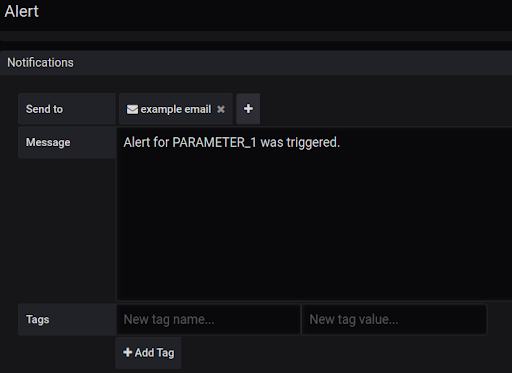
Go to the section specifying the notification channel. We will use the “example email” channel which we had created previously:
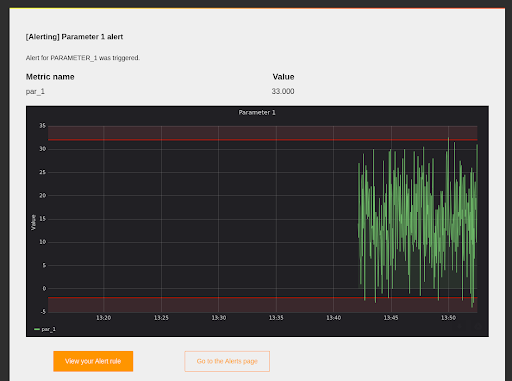
To apply changes, save the dashboard. After we run the Python script and wait for a while, we will start to receive emails with notifications about the alert. Here is an example of such an email:
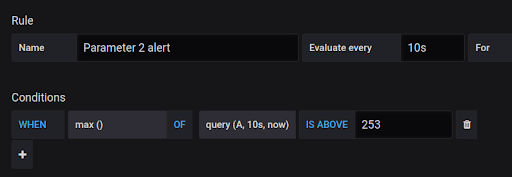
Similarly, we can create other alert rules. Below, you can see the condition of the alert for parameter_2. In this case, we want to receive notifications when the maximum value computed over the last 10 seconds is above 253.
Besides the “out-of-bounds” and “above/below” conditions there is the third condition type – missing values. Here is how it can be configured:

Remember that you can create complex conditions that consist of several blocks. To do this, click on the “Plus” button under the first condition block. Condition blocks can be stacked using the “AND” or “OR” operators. In the result, you can get something like this:

Note, that there are many different functions for evaluation: count, sum, median, diff, min, max, etc. Also, you can set up alerts with other queries (instead of just “A” in our examples above).
For example, suppose that we have two queries: A and B (see the image below). Query A reflects the average value for the parameter_1 over the specified period of time. Query B reflects the sum of values of the parameter_2 over the specified period of time.
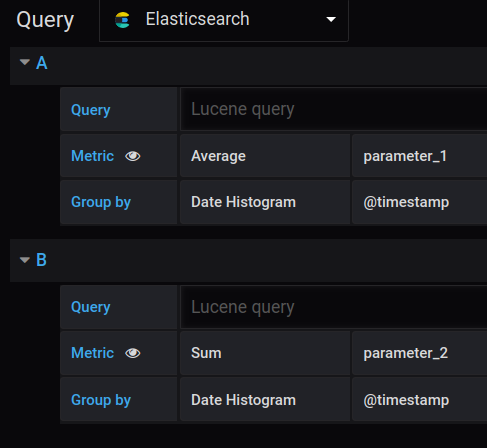
When you have several different queries, you can create alerts based on them:
Useful alerts for monitoring infrastructure and network. For those who monitor the infrastructure and network, there are several types of alerts that can be useful. They can monitor the server load, request latency, error rates, and memory usage. If you want to monitor the performance of the application, there can be even more use-case-specific metrics to monitor. For example, there could be an alert about the large number of new user registrations over a short period of time. Remember, that in the panel query (which was named “A” in our examples) you can include the custom request to the data source. To do this, use the Query field (see the image below). In the case of the ElasticSearch source, this should be a Lucene query.
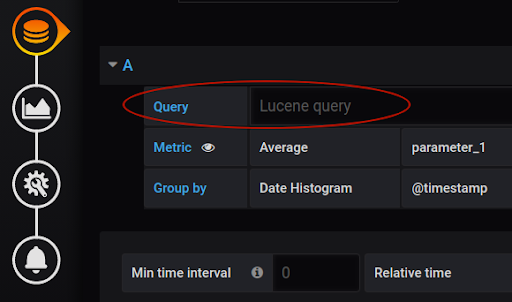
The availability to create custom requests extends your potential capabilities to develop complex alert conditions.
Hope this article helped you understand how to setup Grafana alerting, do try at your end. Reach our tech experts incase of any doubts.
If you’re looking for Grafana subscription, services or support, talk to Grafana’s regional partner, Ashnik now.


